

SITCOMTN-169
Some investigations on the DIMM measurements#
Abstract
In this Technote we present the results of an analysis of the DIMM measurements.
Introduction#
The Differential Image Motion Monitor (DIMM) installed on Calibration Hill provides atmospheric seeing measurements that can be compared with the PSF FWHM derived from LSSTCam images, as well as with the seeing reported by the nearby RINGSS instrument at Gemini. The PSF FWHM, after correction for airmass and wavelength dependence, still includes instrumental contributions (such as dome seeing and AOS corrections) that are absent in the DIMM measurements. However, in some cases the DIMM reports seeing values significantly larger than the PSF FWHM. This Technote presents the results of an analysis conducted to investigate this behavior.
Correlation with the wind speed and direction#
This part of the analysis rely on the measurements recorded in the Consolidated Database (ConsDB). The PSF FWHM is the median value of the PSF FWHM measured on the LSSTCAM focal plane. It is corrected for the airmass and the wavelength dependence. The reference wavelength is 500 nm. The wind speed and direction is measured by a weather station located on Calibration Hill close to the DIMM.
At the time of the analysis, the RINGSS measurement were not recorded in the ConsDB and were recovered from the EFD database using the RingssSeeingMonitor utility
In the following plots we show the correlations between the PSF FWHM and the RINGSS seeing (upper plot), the PSF FWHM and the DIMM seeing (mid plot) and the DIMM versus the RINGSS seeing. The direction of the wind is indicated by the arrows. The modules and the colors of the wind vectors show the wind speed.
We see that a large fraction (25.2%) of the DIMM seeing measurement is larger than the PSF FWHM. We also note that the PSF FWHM is better correlated to the RINGSS than with the DIMM.
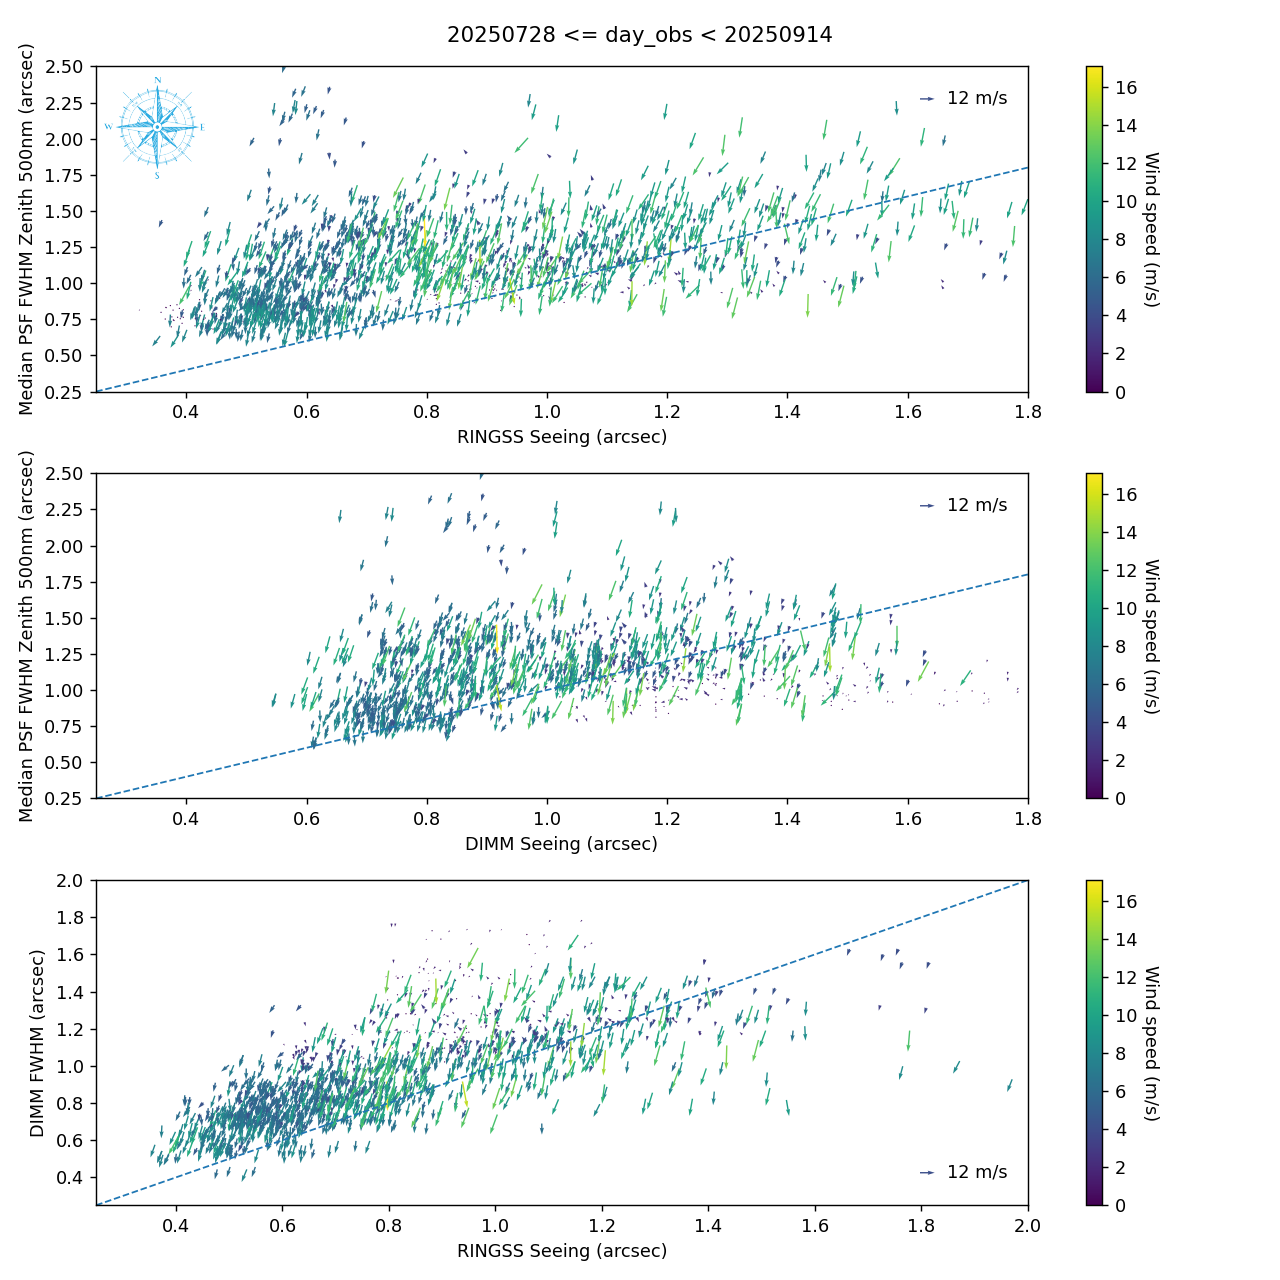
Fig. 1 Correlations between various estimations of the seeing (LSSTCam PSF, RINGSS and DIMM). The wind speed and direction are also represented.#
The following plot is an histogram of the wind speed when the PSF FWHM is smaller that the DIMM seeing (in orange) and when the PSF FWHM is larger than the DIMM seeing (in blue). We see that a significant fraction of pathological cases where the PSF FWHM is smaller than the DIMM seeing is associated to a low wind speed.
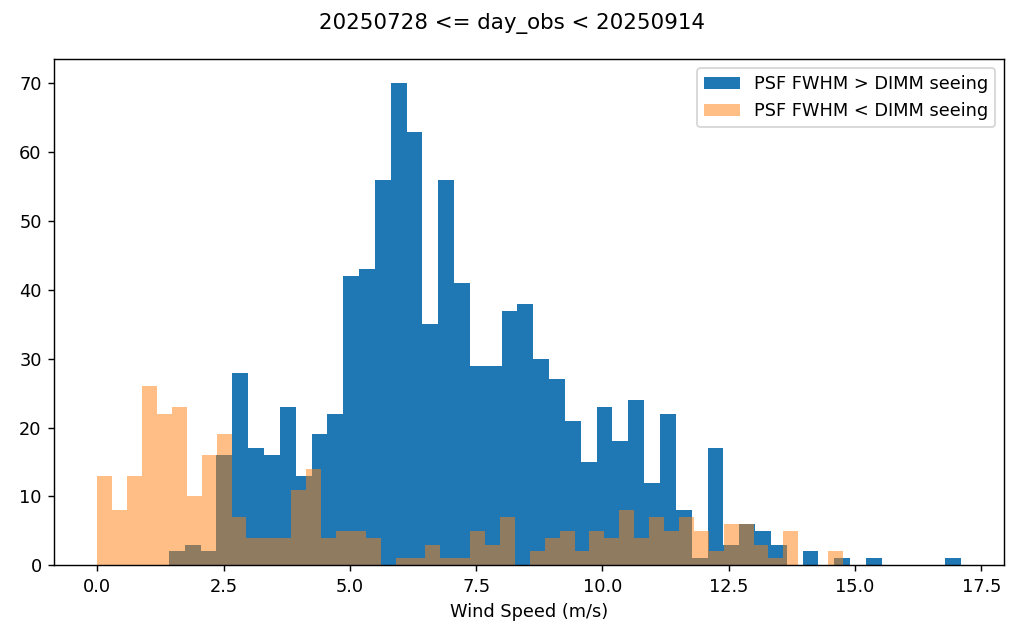
Fig. 2 Histogram of the wind speed for PSF FWHM < DIMM seeing (orange) and for PSF FWHM > DIMM seeing (blue)#
The next plot is the histogram of the wind direction when the PSF FWHM is smaller that the DIMM seeing (in orange) and when the PSF FWHM is larger than the DIMM seeing (in blue). A fraction of the pathological DIMM measurements (in orange) seems to be associated to wind directions different from the dominant wind but it should be noticed that the wind direction tend to fluctuate a lot when the wind speed is low.
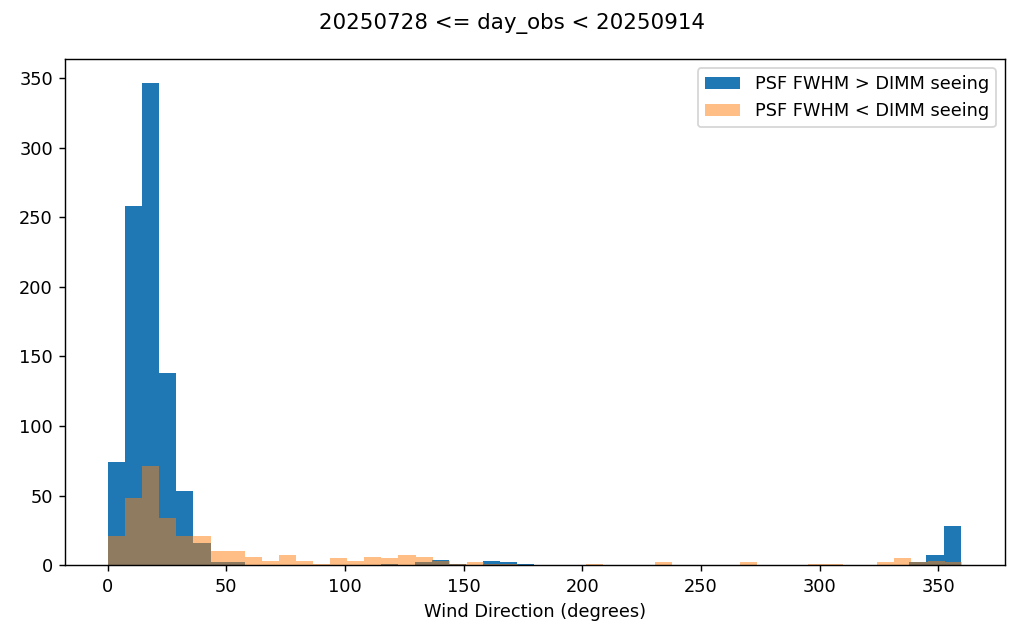
Fig. 3 Histogram of the wind direction for PSF FWHM < DIMM seeing (orange) and for PSF FWHM > DIMM seeing (blue)#
The following plot is the distribution of the data taking time in Chile timezone for PSF FWHM < DIMM seeing (light red) and for PSF FWHM > DIMM seeing (blue). We don’t see any specific pattern in this plot that could support the idea that the pathological DIMM seeing measurements are occurring at the beginning of the hight when the thermal equilibrium is not established between the inside and the outside of the DIMM dome.
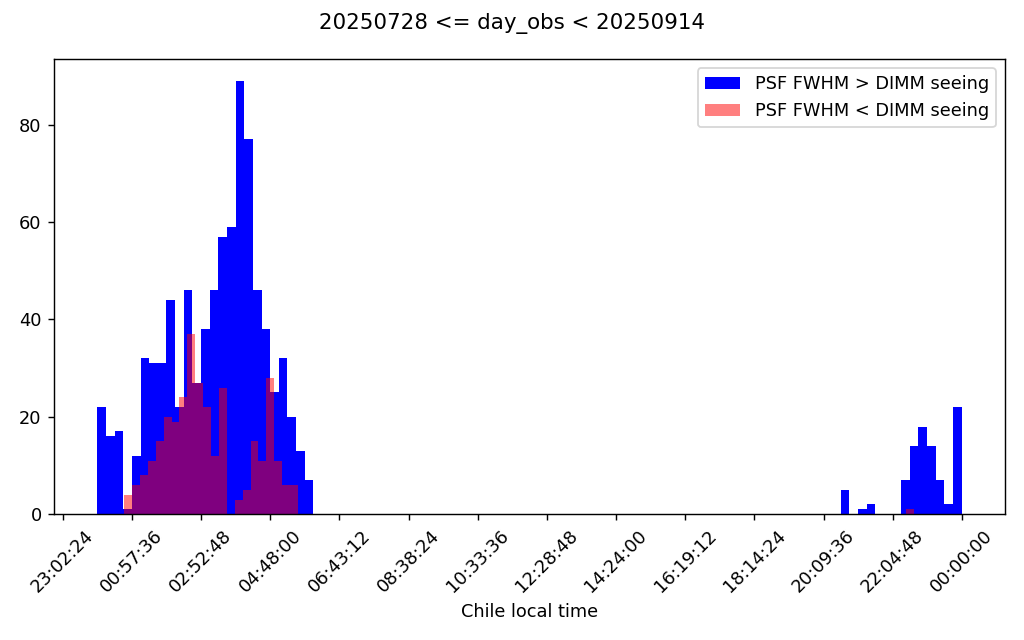
Fig. 4 Distribution of the data taking local Chile time associated to PSF FWHM < DIMM seeing (light red) and to PSF FWHM > DIMM seeing (blue)#
The following plot shows the correlation between the LSSTCam median PSF FWHM and the wind speed. We clearly see a positive linear correlation for wind speed between 0 and ~4 m/s.
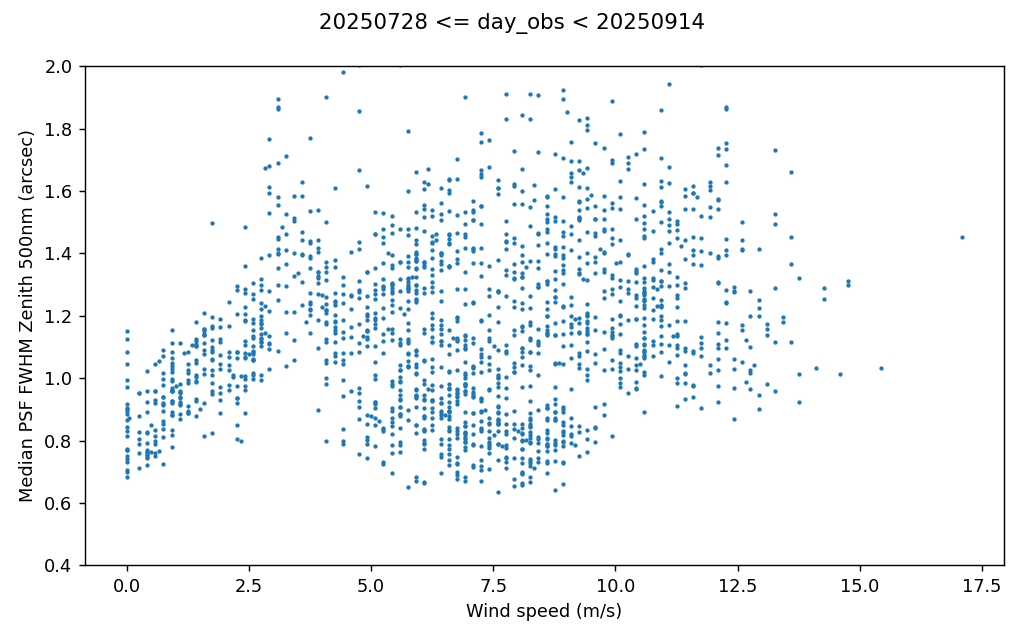
Fig. 5 Correlation between the LSSTCam median PSF FWHM and the wind speed#
The next plot is the correlation between the DIMM seeing and the wind speed. The red dots correspond to cases where the PSF FWHM is smaller than the DIMM seeing. For the DIMM seeing the correlation at low wind speed (< ~6 m/s) is opposite to the PSF FWHM one.
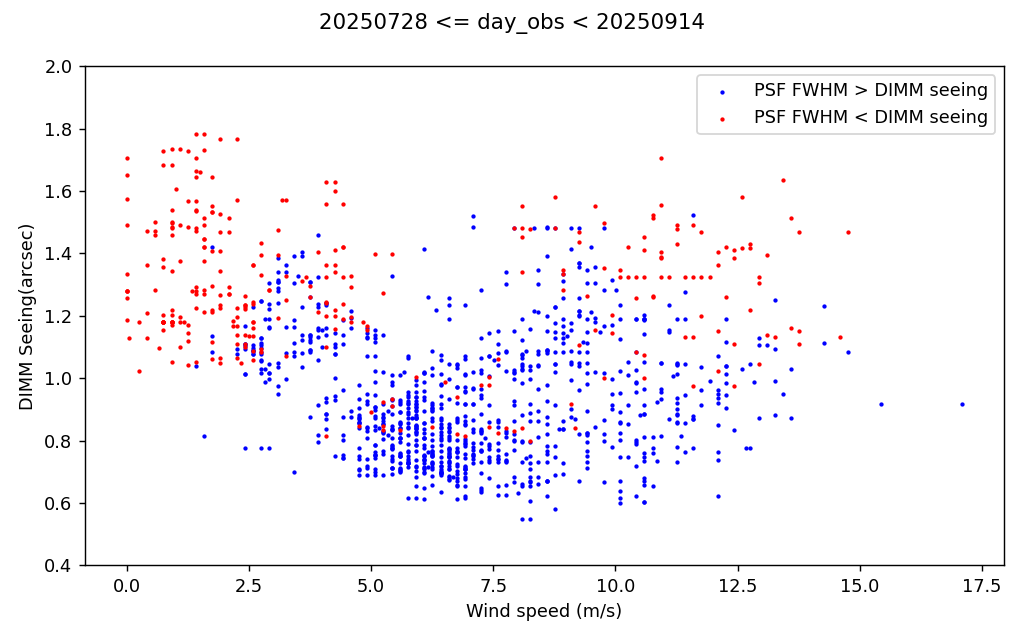
Fig. 6 Correlation between the DIMM seeing and the wind speed#
Detailed investigation of the DIMM functioning#
The information available in the EFD related to the DIMM is very limited. In order to get the full details of its functioning, one needs to access to the output files on the DIMM server. In the next figure, the upper plot shows the DIMM seeing (blue line) as a function of time. The red dots are the LSSTCam PSF FWHM and the vertical lines show the times when the DIMM is pointing to a star. The lower plot shows the noise associated to the position measurement in the X direction (blue line). This quantity (as well as the noise in the Y direction) seems to be sensitive to the quality of the DIMM measurements. The wind speed is also shown in green.
On this specific date, a large fraction of the DIMM measurements give values of the seeing significantly larger than the PSF FWHM. We also see that in two cases the DIMM stopped working for an unidentified reason and restarted after ~20 minutes.
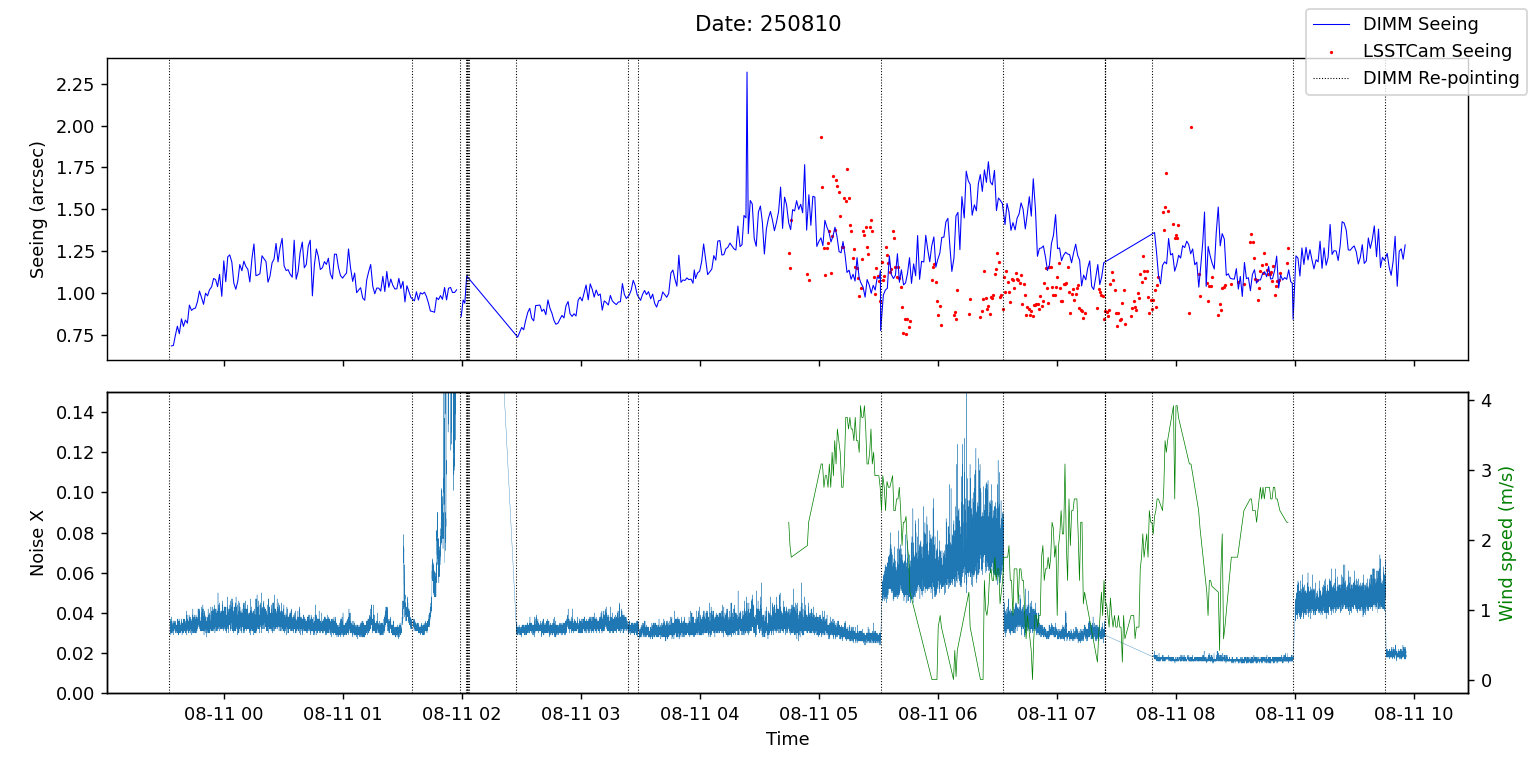
Fig. 7 Detailed timing associated to the DIMM measurements for the night 2025/08/10 - 2025/08/11#
(Un)Conclusion#
So far, we have not been able to determine why, in some cases, the DIMM reports seeing values significantly worse than the PSF FWHM. The only notable observation is that part of these anomalous measurements appear to be linked to low wind speeds. At present, the most plausible hypothesis is that the thermal dissipation of the DIMM equipment requires a minimum wind speed, although additional evidence is needed to confirm this with certainty.